
The Sunbelt Slowdown: Florida’s Housing Market Cools as Inventory Builds
March 2025 housing data reveals diverging trends across Sunbelt states—with Florida leading the retreat. Explore data insights through interactive charts

Months of supply is one of the most critical metrics indicating market balance.
A balanced market typically sits around 5 to 6 months of supply. Lower values signal a seller’s market with upward pressure on prices due to scarcity, while higher values suggest a buyer’s market with more negotiating power and potential for price declines.
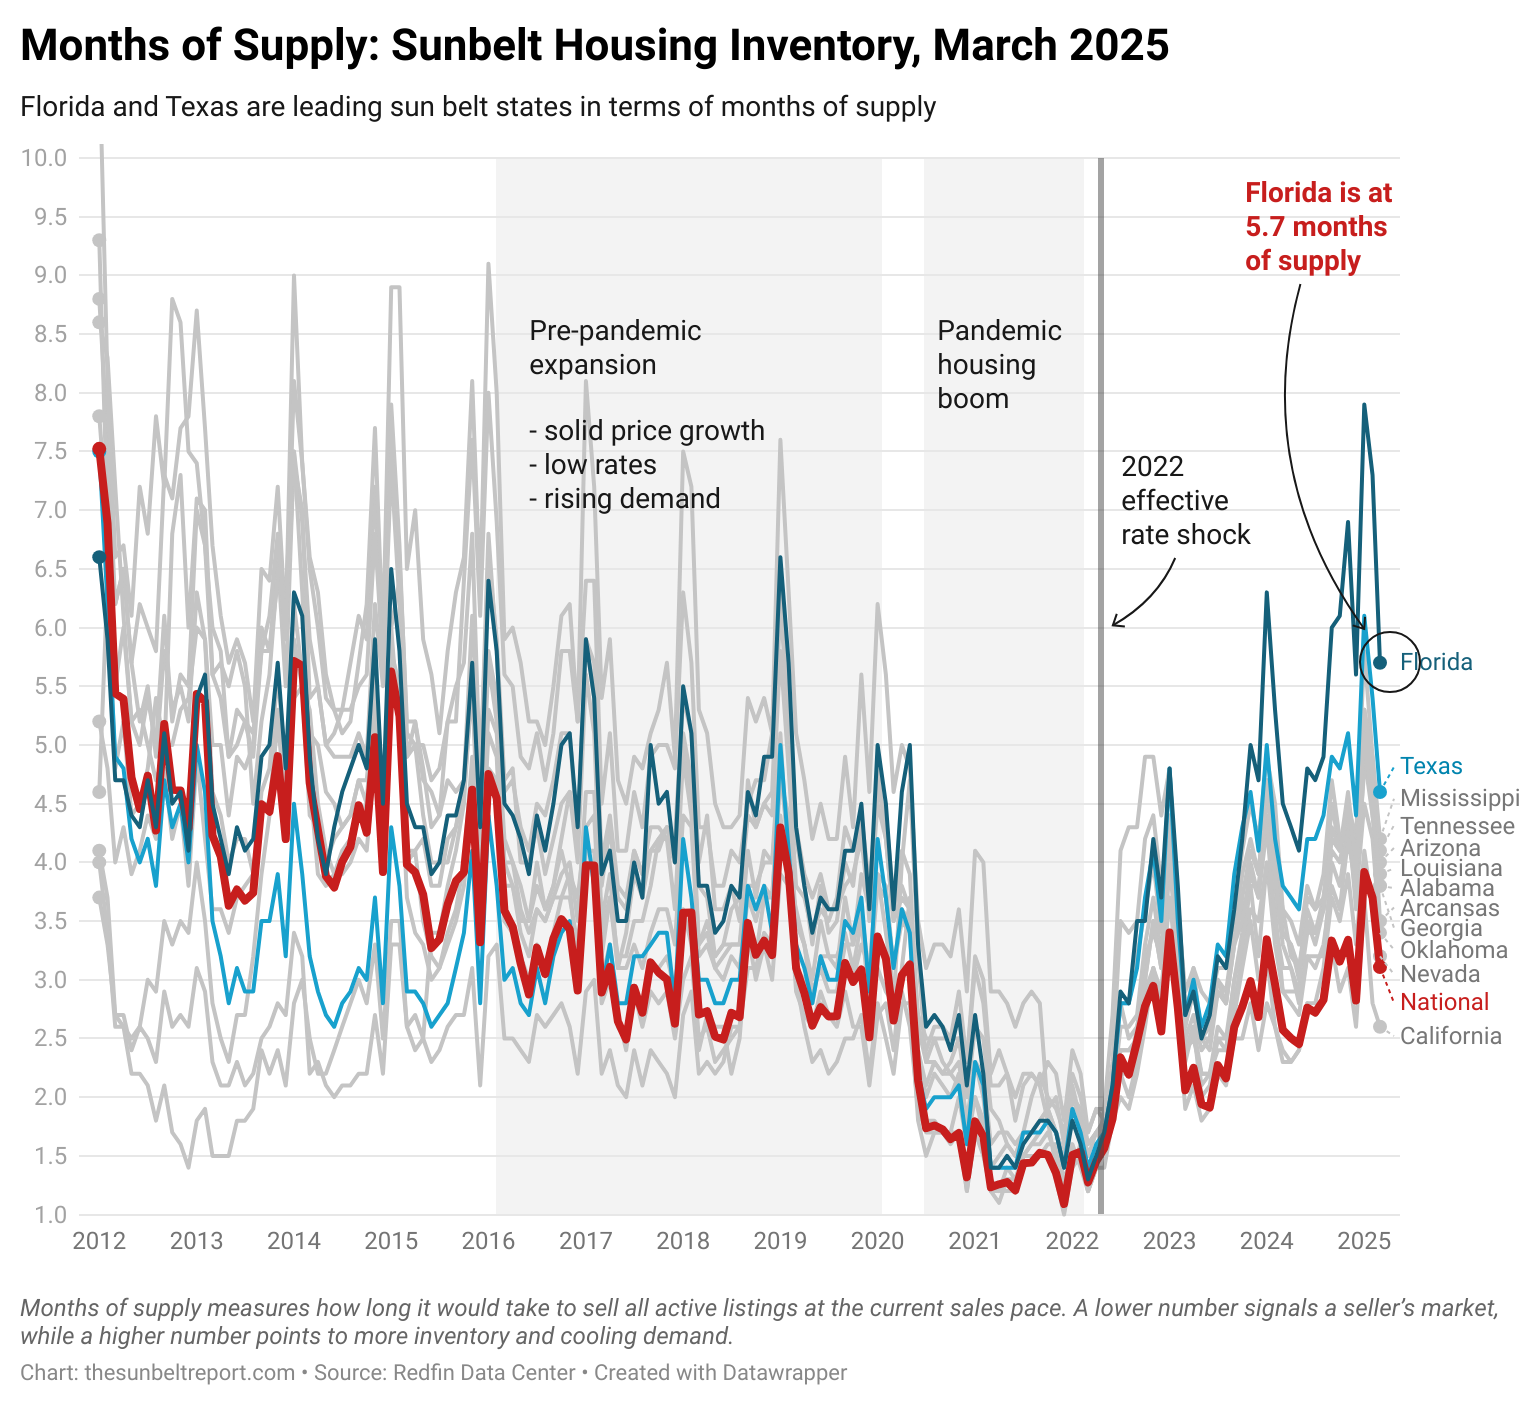
As of March, 2025 the national housing market sits at 3.0 months of supply, but Sunbelt states are showing signs of divergence. Florida stands out with 5.7 months of supply, nearly double the national average. Seeing 5.7 months of supply is unusual, even compared to the pre-pandemic expansion phase. Months of supply peaked in Florida in January 2025 with a value of 7.9.
Where months of supply comes from?
The formula is pretty simple: Months of Supply = Total Active Listings / Monthly Sales Pace.
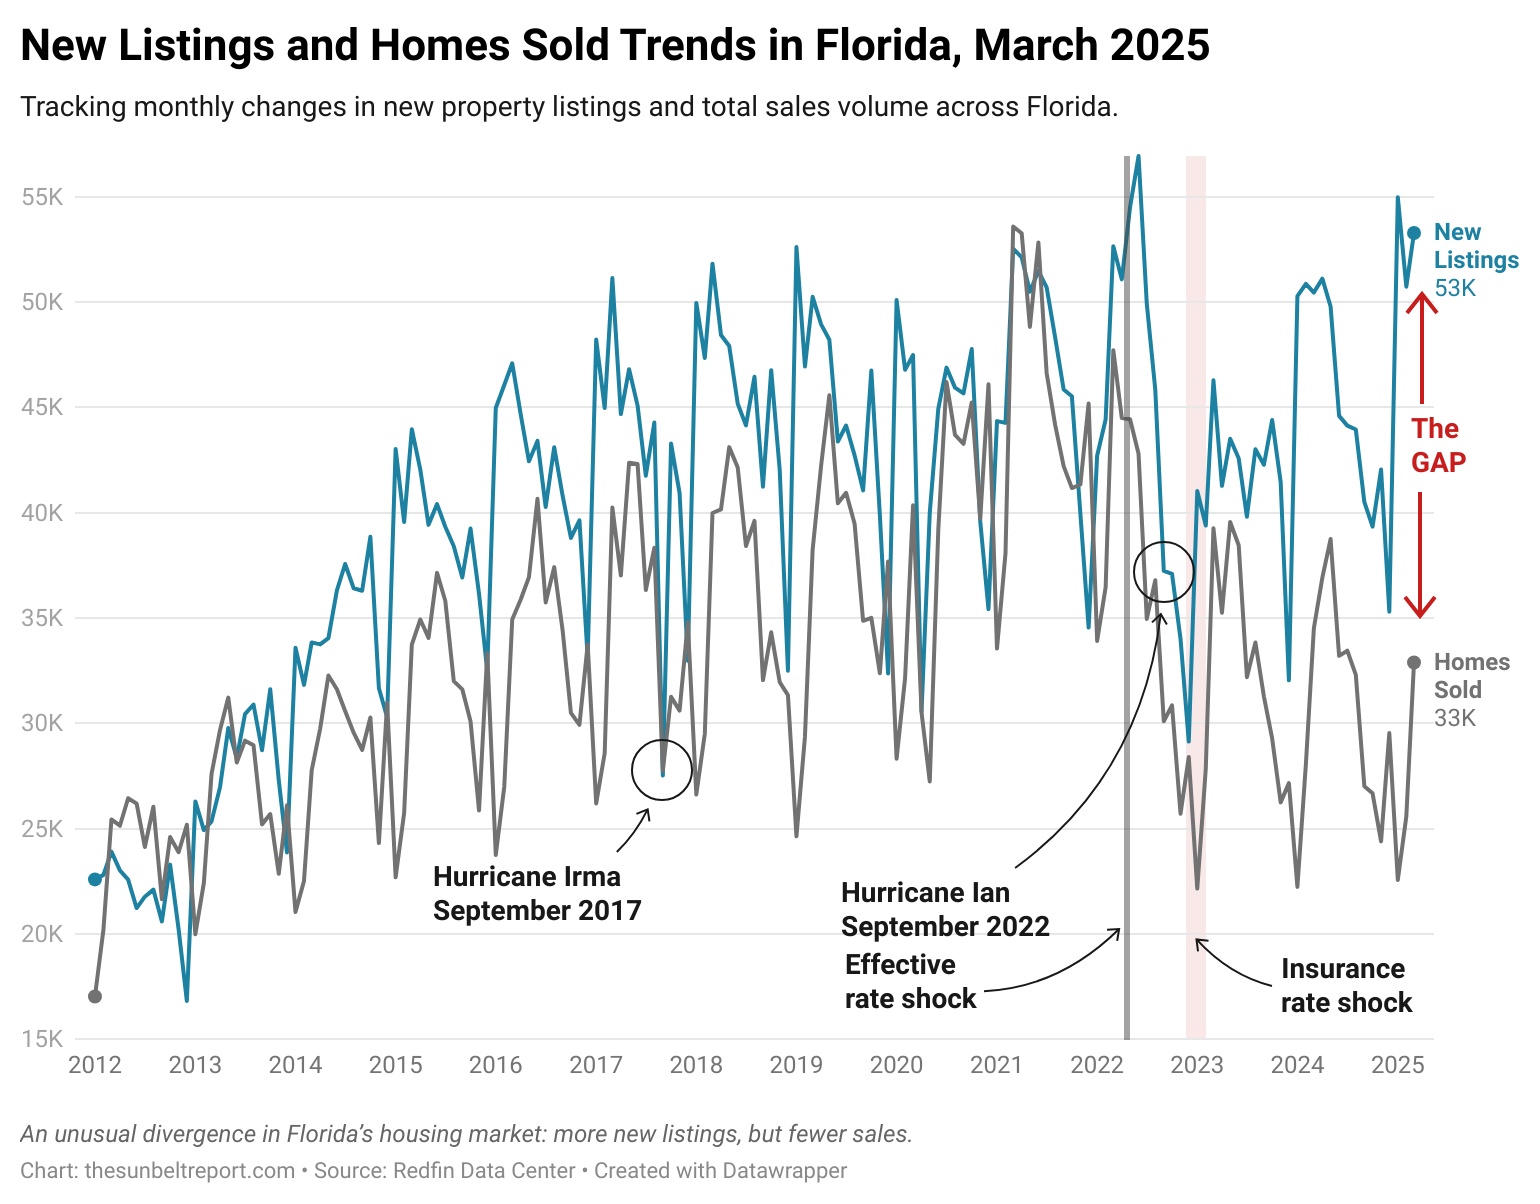
In Florida right in March 2025 33 thousand homes where sold, while 53 new listings were added to the market, which is vey non-typica given the historical trends (see image above).
From a market dynamics perspective, there is nothing unusual in sales dropping in Florida after the 2022 effective rate shock. What is unusual is the high amount of new listings (see chart above).
Another important attribute to track is median days on the market.
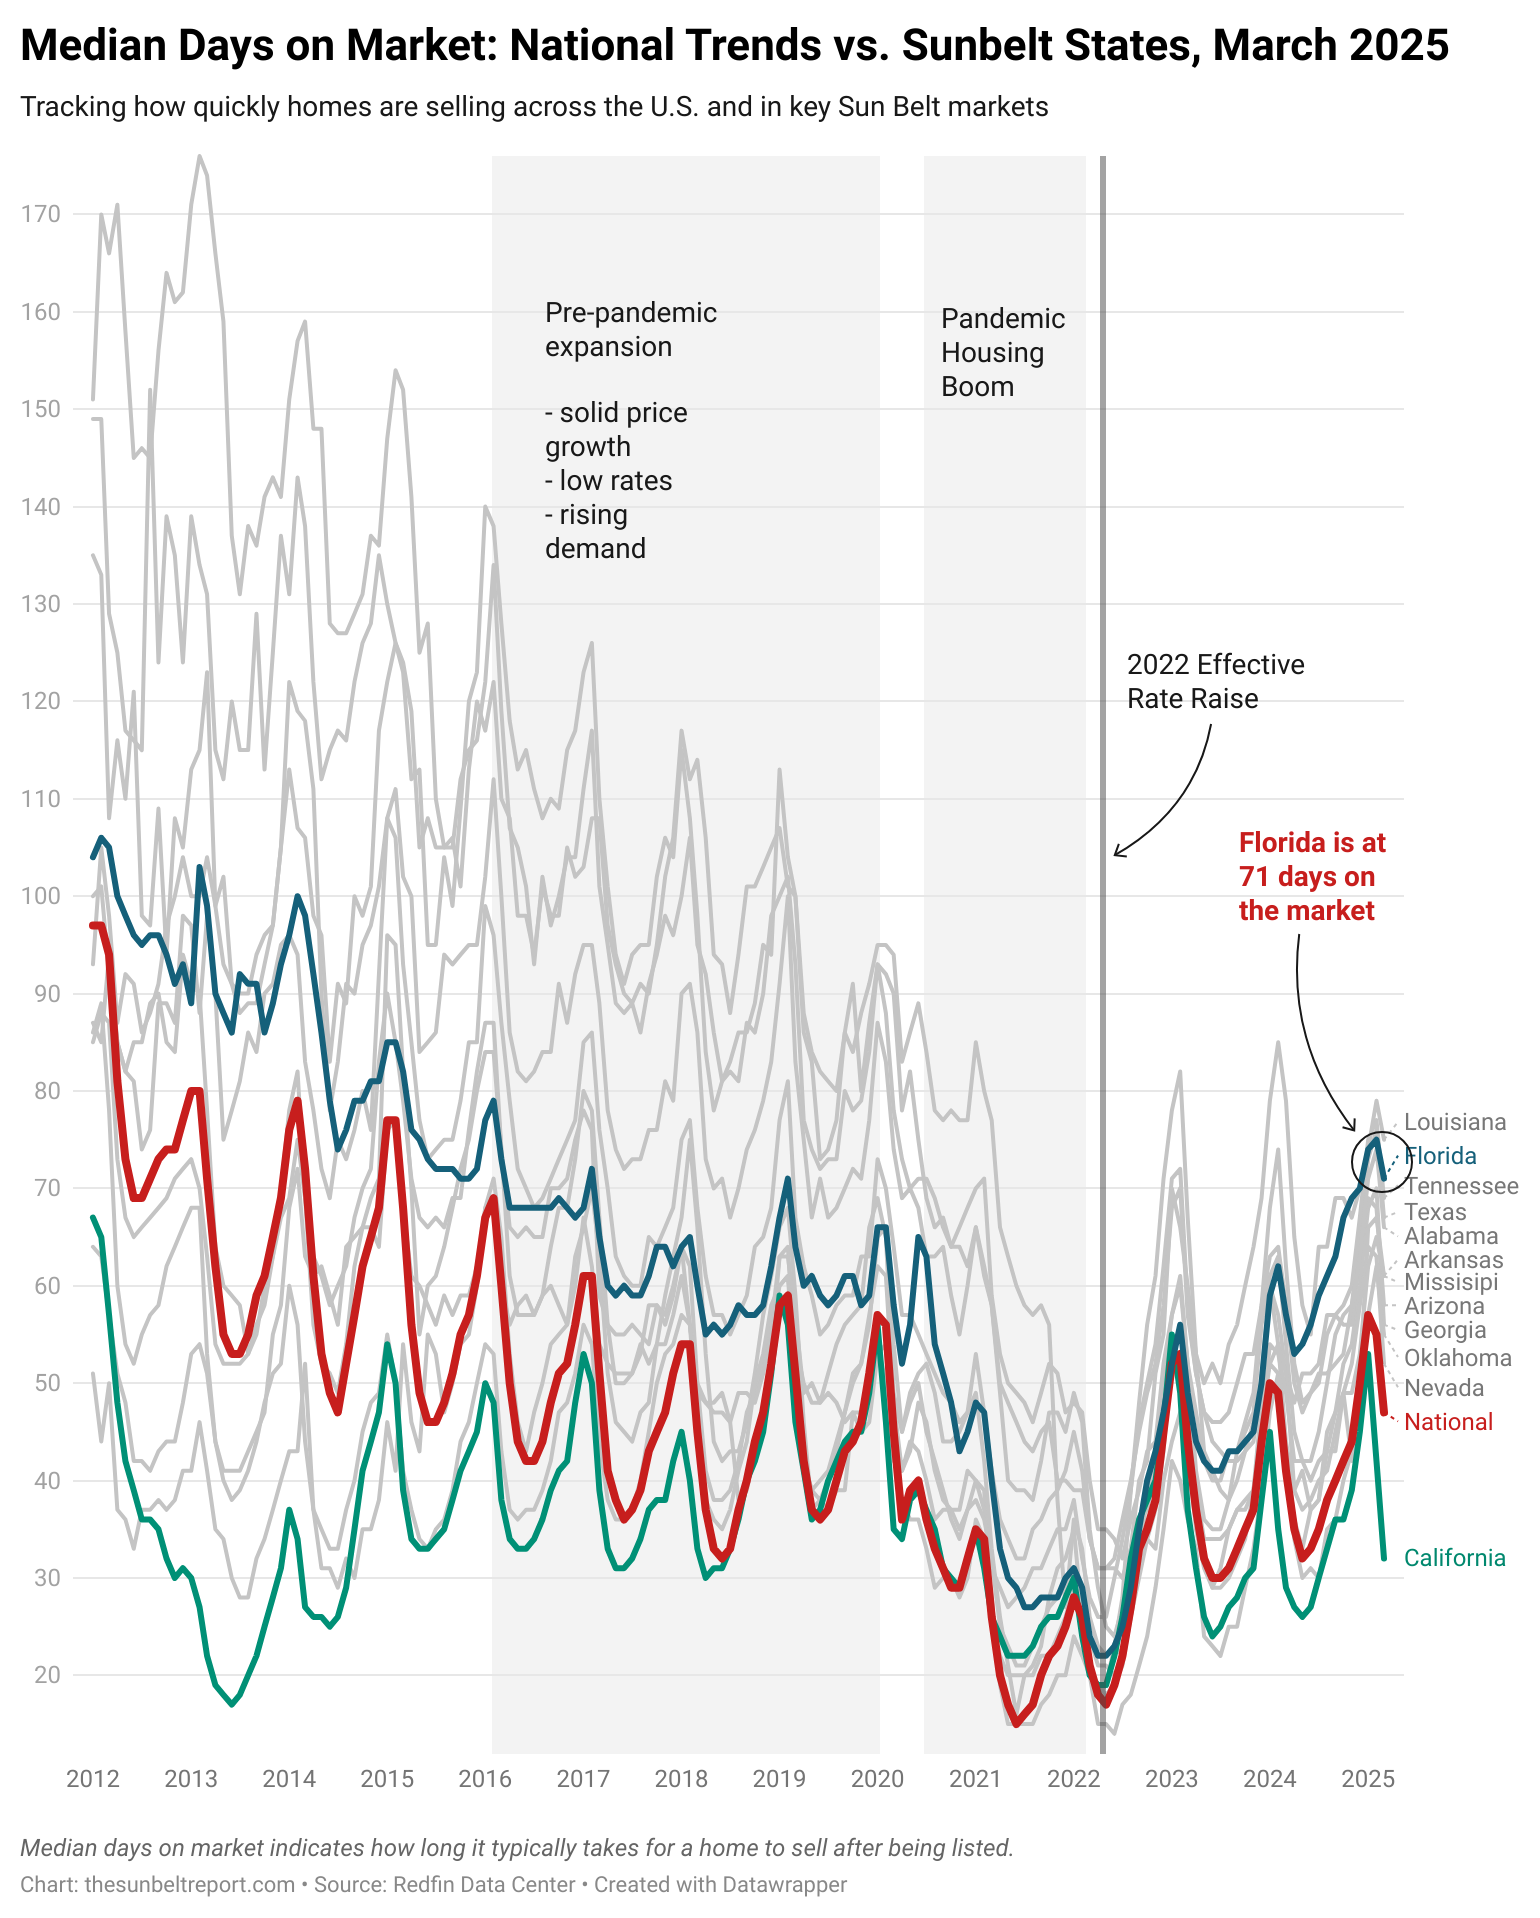
Low Median DOM (e.g. 10–20 days): Hot market, homes sell quickly, strong buyer demand.
High Median DOM (e.g. 60–90 days): Slower market, buyers are cautious, potential overpricing or too much inventory.
Nationally, the average days on market is 47, but Florida again leads the pack with homes sitting an average of 71 days before going under contract. This signals buyer hesitation and potentially overpriced listings in a cooling market.
Interestingly, Florida has been alsways sitting above the national days on the market trend, while California almost always lower.
Subscribe for more detailed statistics on sun belt states.