
A Pre-Tariff Look at a USA Housing Market
Falling sales, rising supply, and weakening pricing power—especially for condos and co-ops—as bidding wars fade. Explore through interactive charts and maps/s.

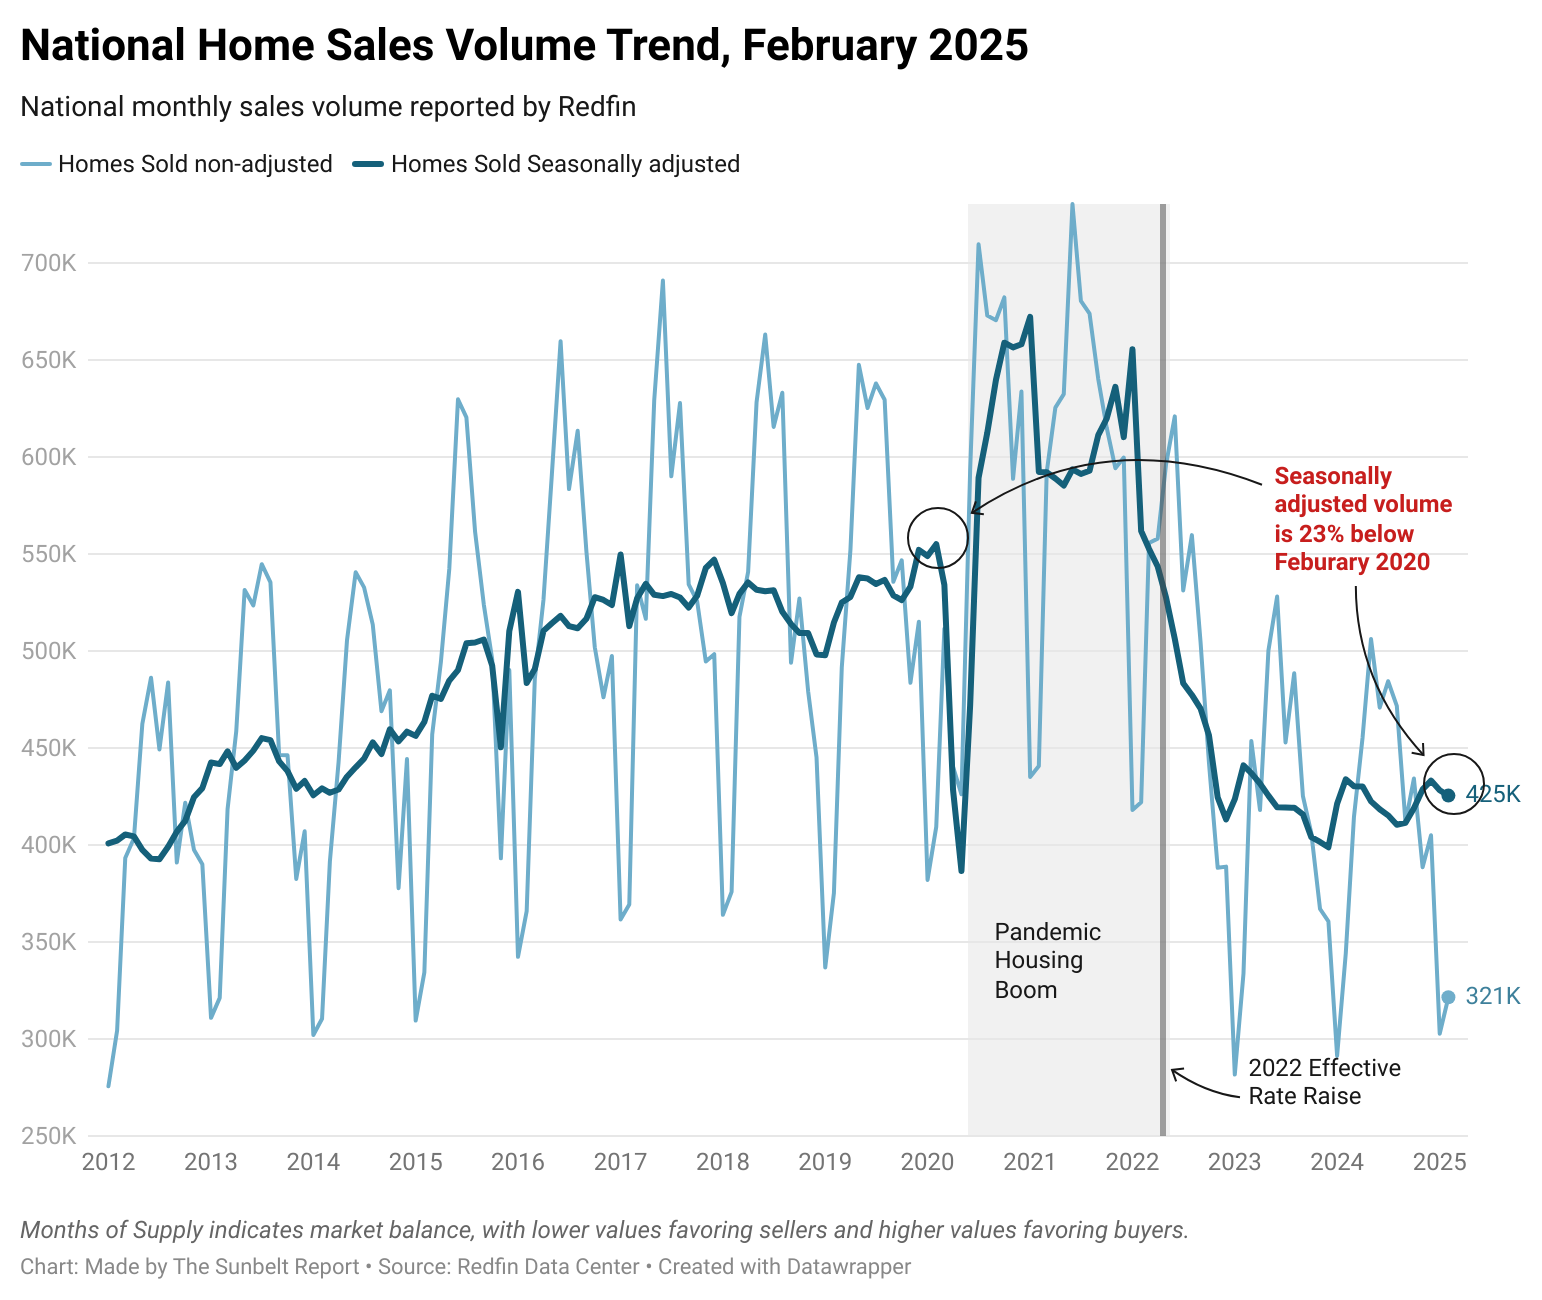
National home sales—both seasonally adjusted and non-adjusted—remain 23% below pre-pandemic levels. The trend line has yet to recover, with many would-be buyers either priced out or holding back due to elevated mortgage rates and economic uncertainty.
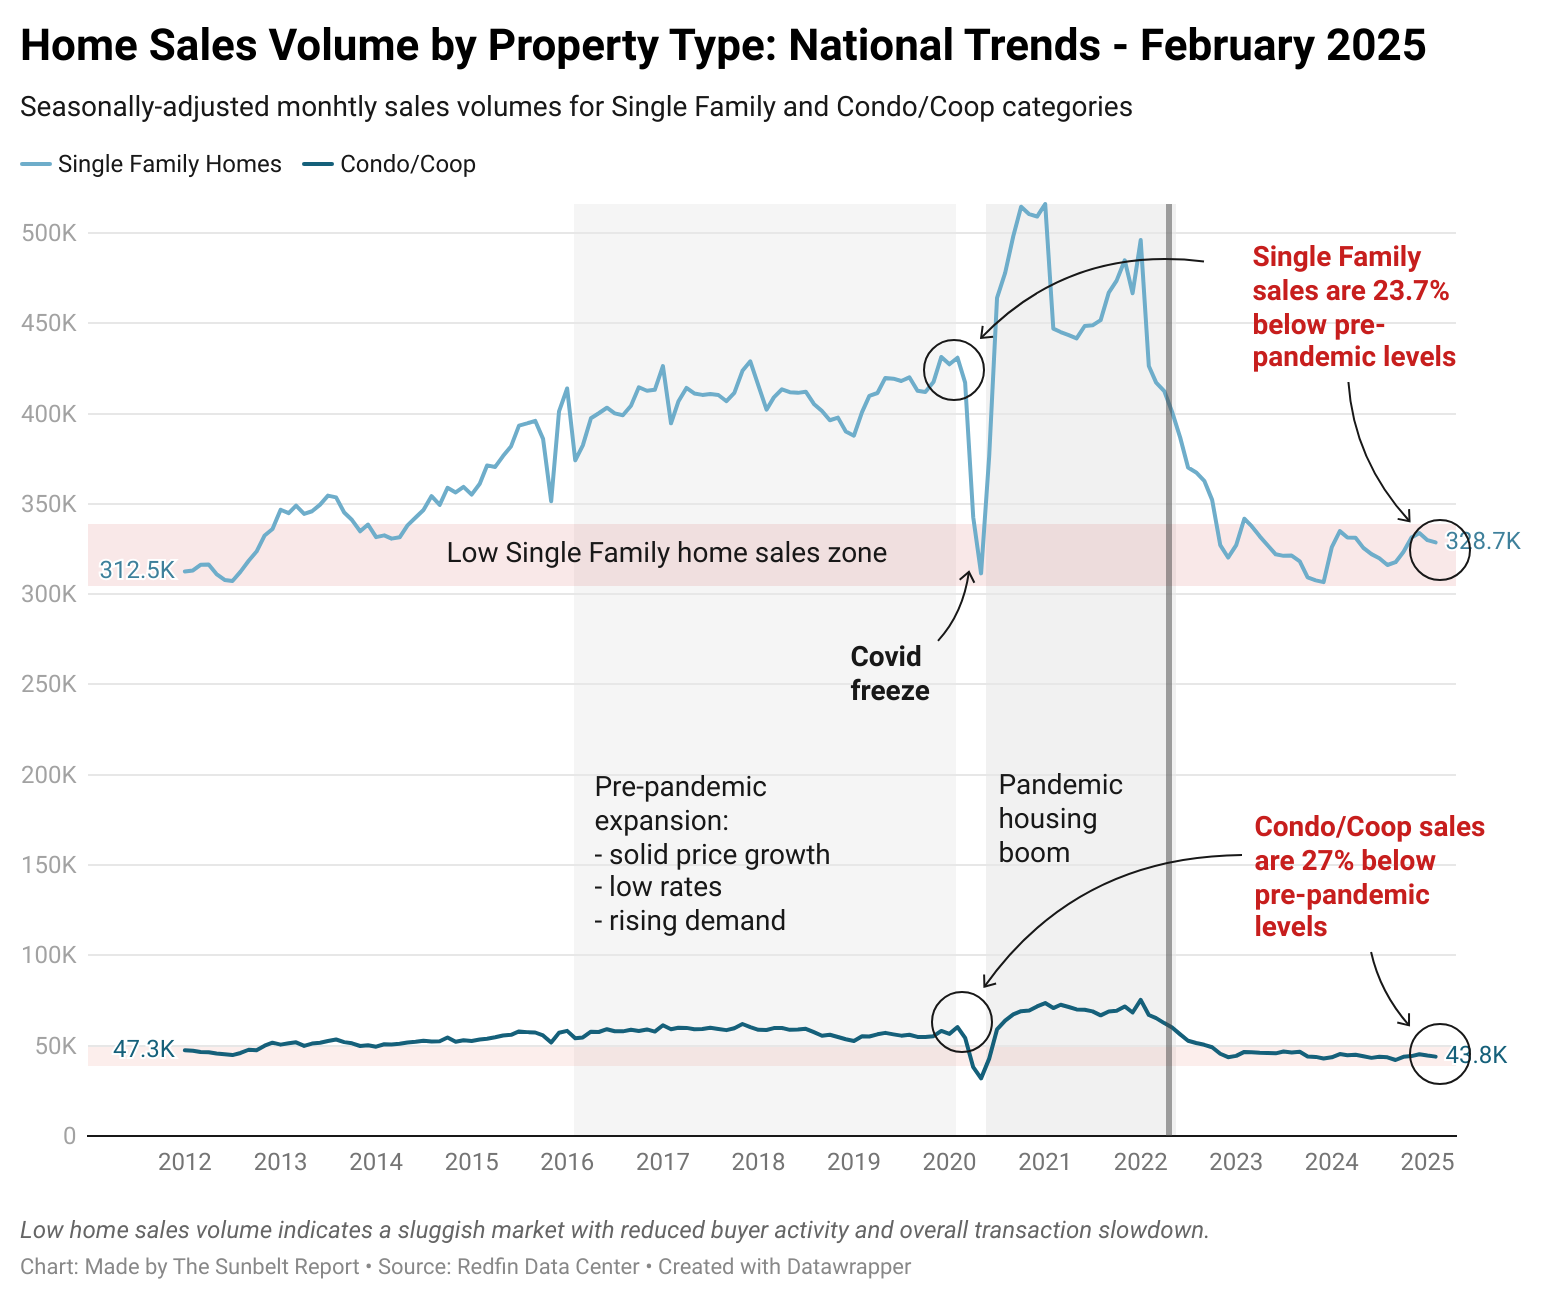
If we look at the seasonally-adjusted home sales volume by property type for Single Family and Condo/Co-ops categories separately, we will see that Condo/Co-op category experiences a greater drop in sales of 27%.
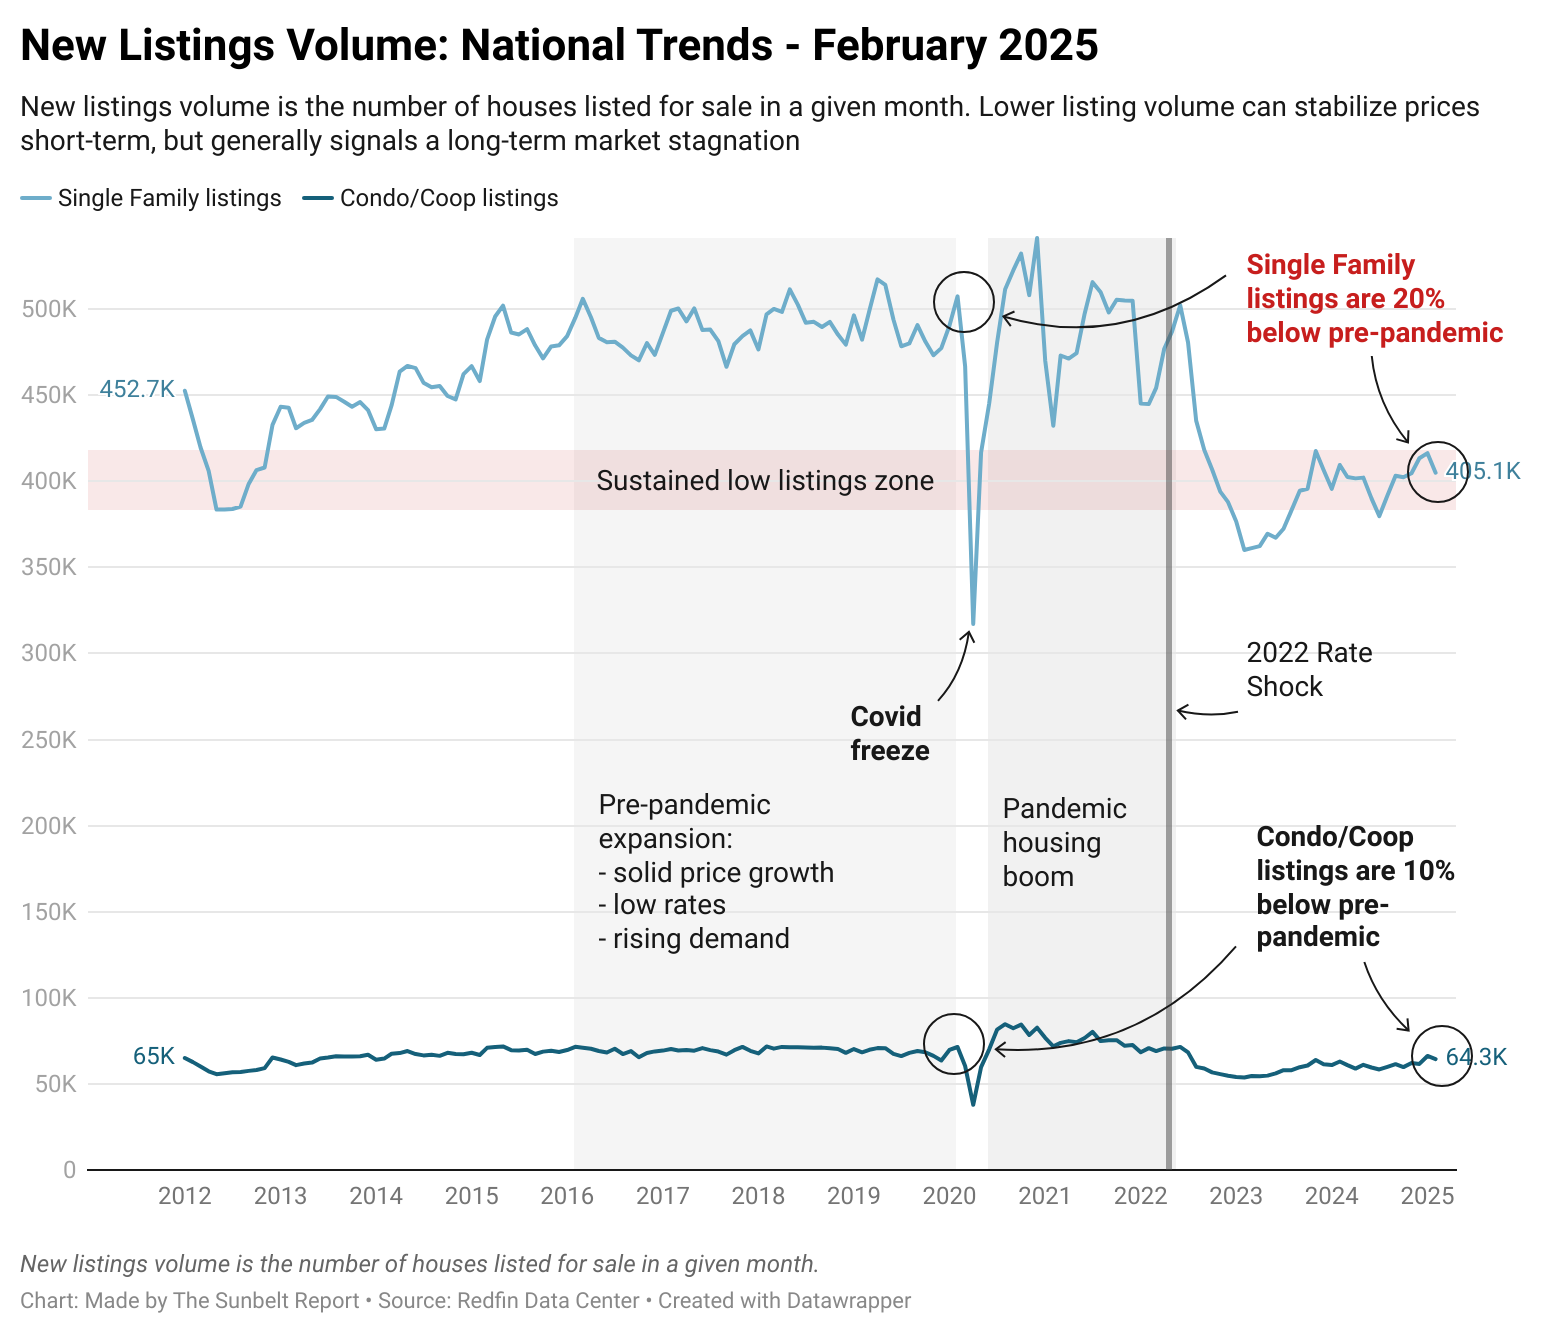
A drop in sales volume is expected, given the current rates and rising home insurance costs. What is unusual, and important to highlight, is that the dynamics of new listing (how many properties enter the market) does not follow the drop in sales.
If you look at the chart below, while Single Family listings experience a 20% drop, whileCondo/Co-op listings only dropped 10% with 64,300 new listings in February.
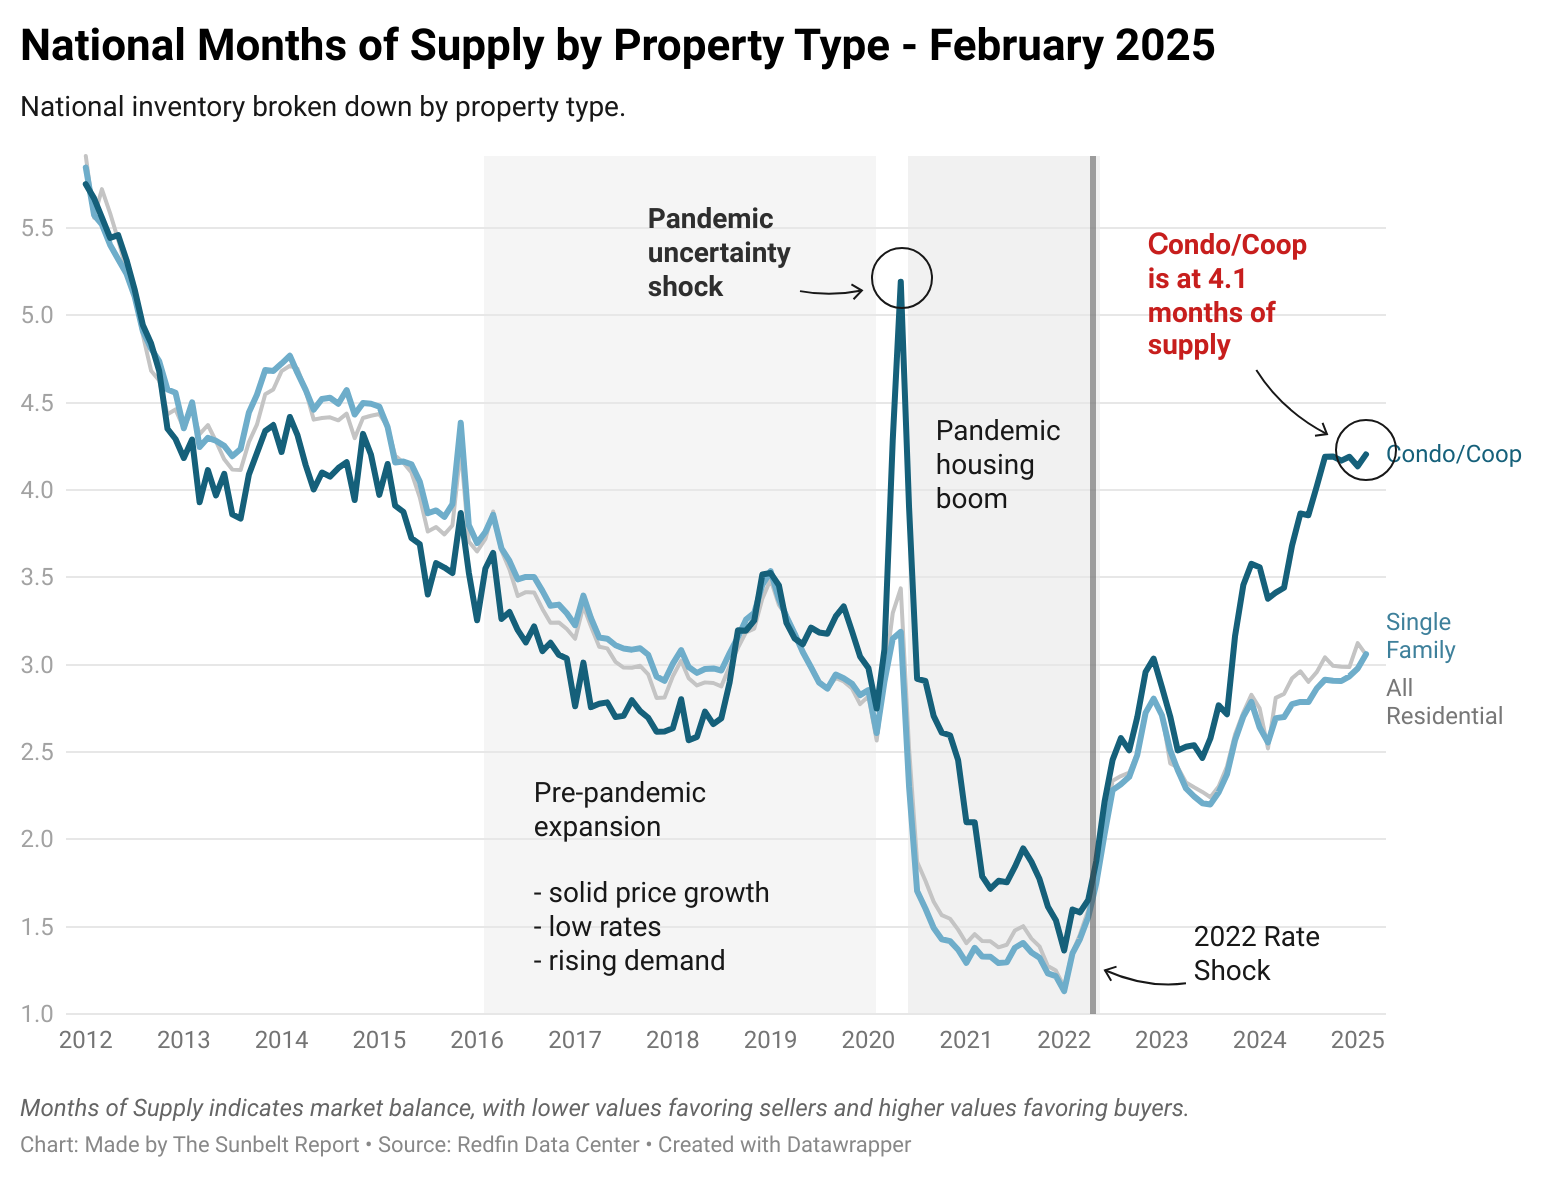
This imbalance fundametally pushes the months of supply metric higher.
Months of supply is a key indicator of market balance—it shows how long it would take to sell all current listings at the current pace of sales. A low number signals a seller’s market with limited inventory, while a higher number suggests a buyer’s market with more options and softer pricing power.
Single family category is at 3.1 months of supply nation-wide, while Condo/Co-op is at 4.1, setting it to a 2014-2015 level.
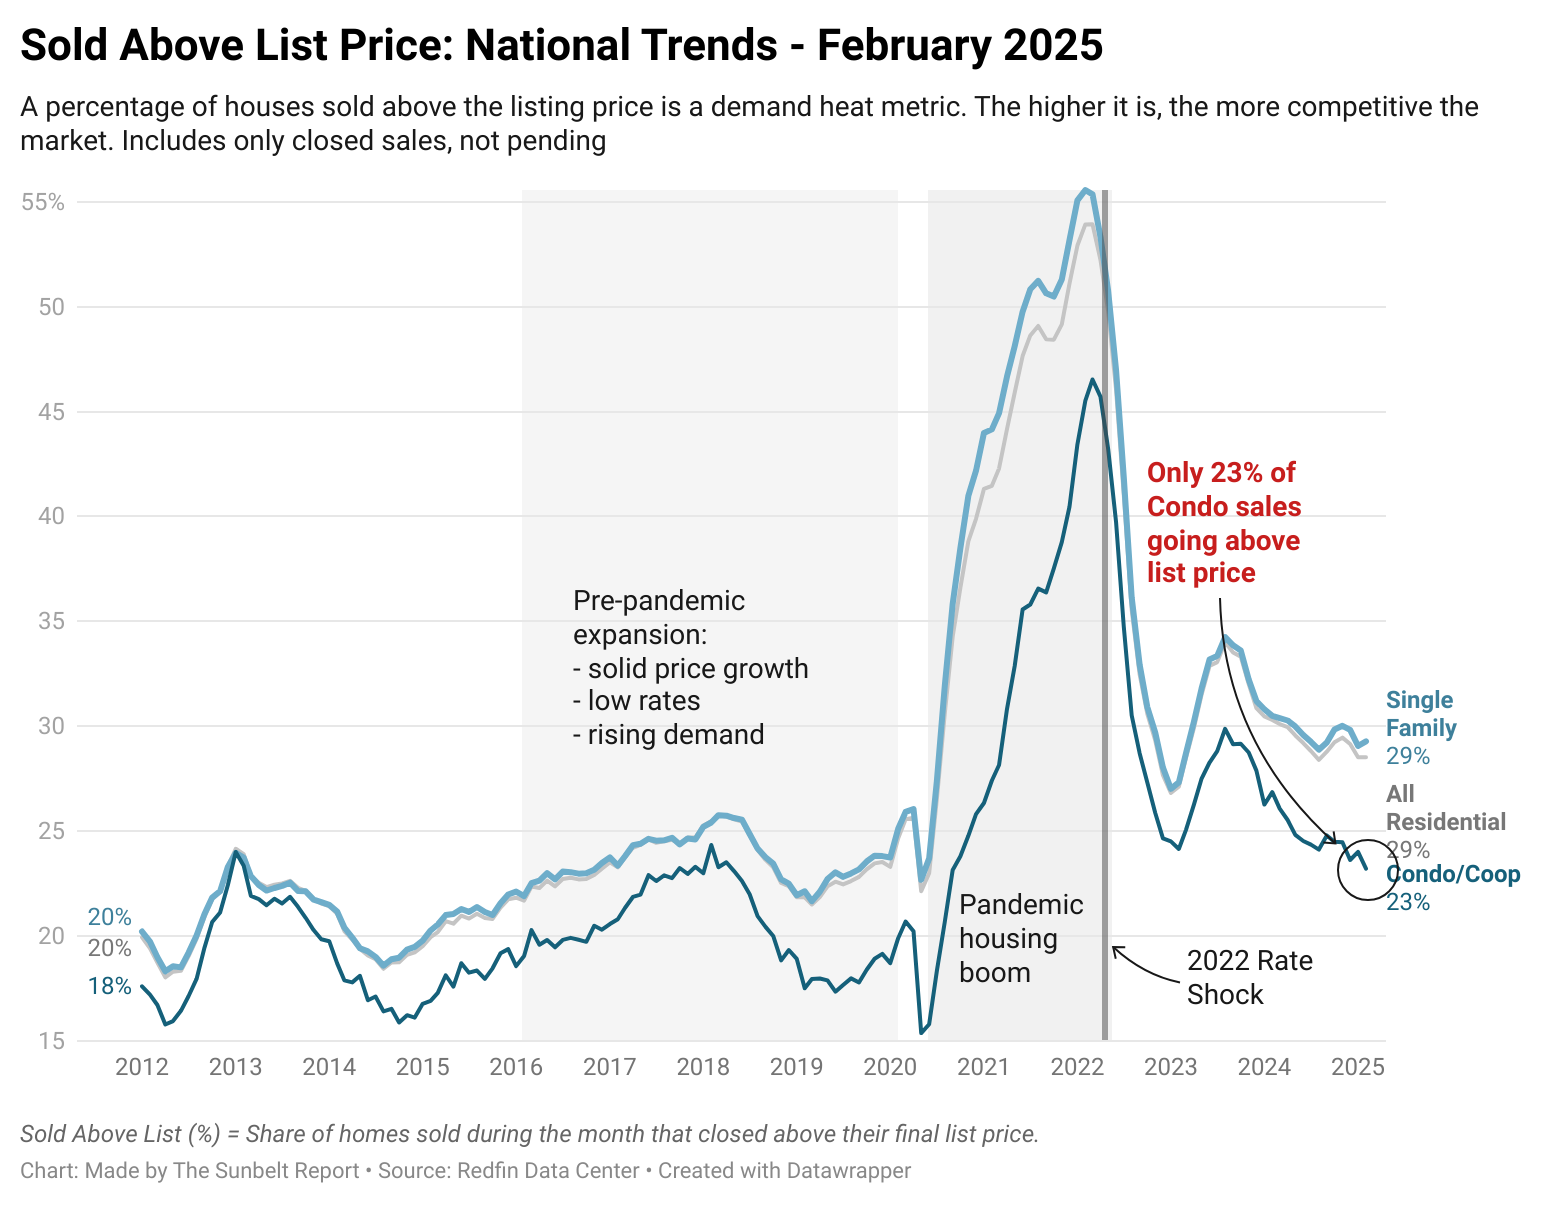
The percentage of houses sold above listing price is on the downward trajectory signaling a cooling in bidding wars.
Single-family homes: 29% sold above list price (downtrend)
Condos/co-ops: 23%, with an even steeper decline
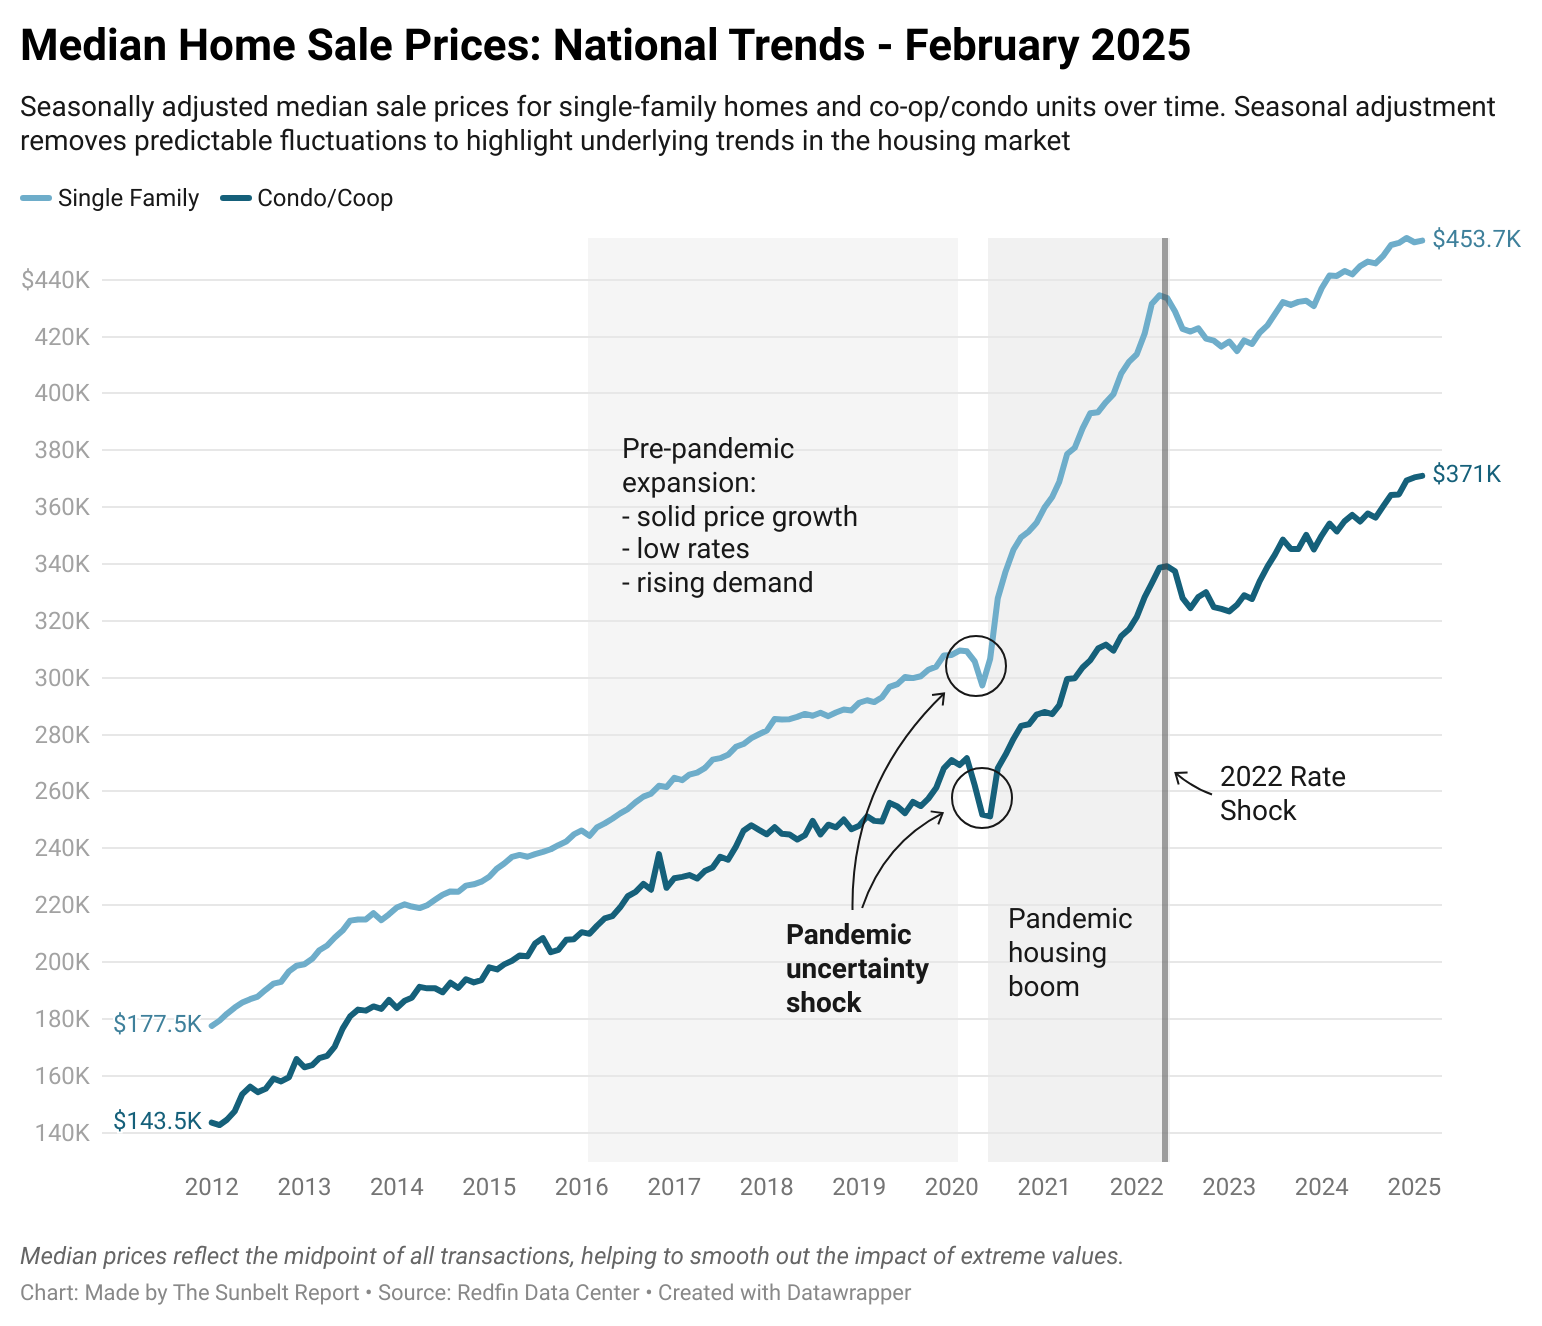
Median sale prices continue to rise slowly. In February:
Single-family homes posted a median of $453,000
Condos and co-ops trailed at $371,000
Both categories show a steady, if modest, increase. But with buyer sentiment weakening, how long this trajectory holds is an open question.
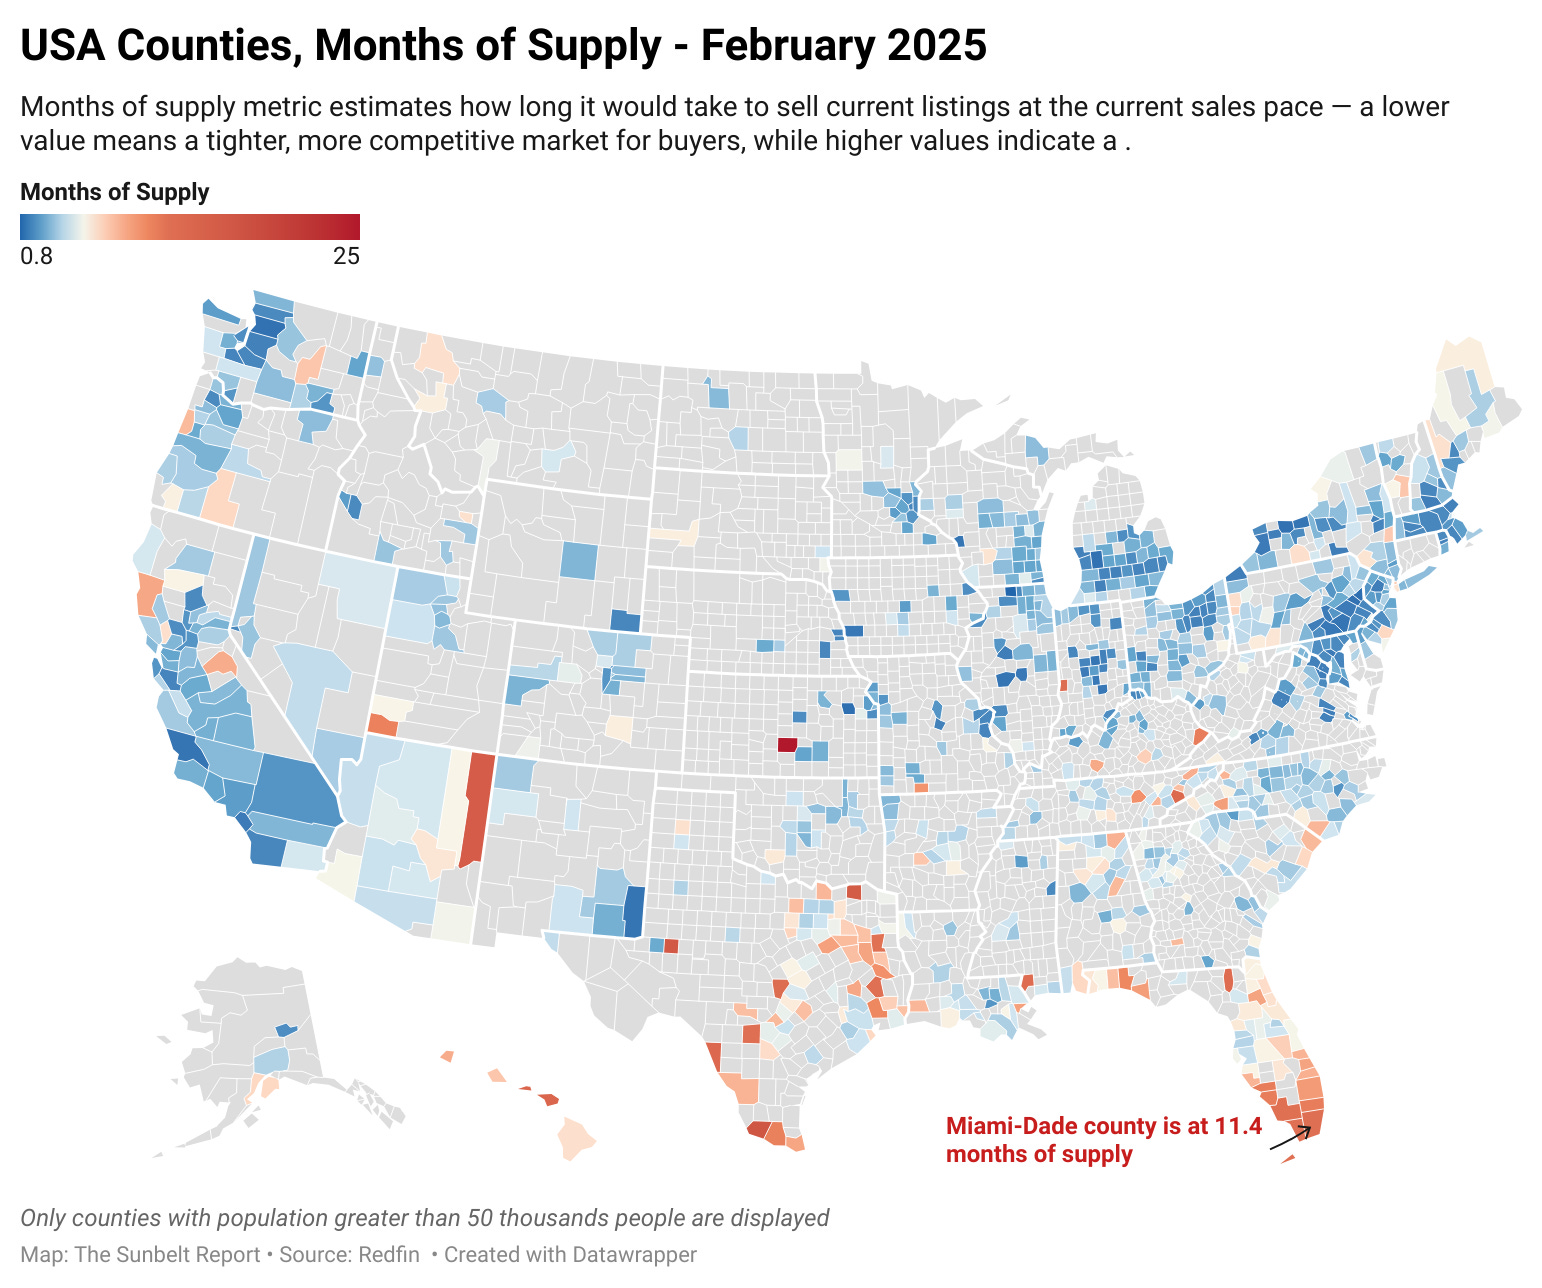
Zooming in on counties with populations over 50k, some of the most buyer-friendly markets now sit in the Sunbelt.
Notably:
Miami-Dade County has surged to 11.4 months of supply, one of the highest among large counties.
This signals a potential glut—particularly risky in vacation-oriented or investor-heavy markets.
Overall, the national housing market has entered a strained phase. The low volume of sales, weakening pricing power, and gradual rise in inventory all point toward a more buyer-favored landscape. Yet, not all segments are equal.
Condos and co-ops appear to be the weakest, with faster-rising supply and sharper declines in bidding wars. If the current trend holds, this category may see more pronounced price corrections in the coming quarters.
In contrast, single-family homes are holding on—but just barely. And in places like Miami-Dade and other Sunbelt hotspots, the inventory is rising too quickly for comfort.
This spring, buyers have more breathing room—and possibly, more leverage.